Logical replication internals
Table of Contents
Introduction
I introduced replication through several posts:
- PostgreSQL 10 : Logical replication - Overview
- PostgreSQL 10 : Logical replication - Setup
- PostgreSQL 10 : Logical replication - Limitations
This new post will dig a little deeper. We will see postgres internals about logical replication. To ease comprehension, I added charts in Netdata that I presented in a previous article. I invite you to click on the images to enlarge them, they will be more readable 😄
I would like to thank Guillaume Lelarge who reviewed this post :)
Spills changes on disk
I noticed that during a big transaction, files appeared in the pg_replslot directory of each replication slot. That’s pushed me to try to understand what these files were for.
PostgreSQL must reorder changes to be applied in good order. To do this, wal sender processes proceed to logical decoding and reorder changes in memory.
However, if the transaction contains a lot of changes, it would eat a lot of memory. So, Postgres writes these changes on disk.
After an exploration in the code, we arrive in the file src/backend/replication/logical/reorderbuffer.c :
 1 139 /*
 2 140  * Maximum number of changes kept in memory, per transaction. After that,
 3 141  * changes are spooled to disk.
 4 142  *
 5 143  * The current value should be sufficient to decode the entire transaction
 6 144  * without hitting disk in OLTP workloads, while starting to spool to disk in
 7 145  * other workloads reasonably fast.
 8 146  *
 9 147  * At some point in the future it probably makes sense to have a more elaborate
10 148  * resource management here, but it's not entirely clear what that would look
11 149  * like.
12 150  */
13 151 static const Size max_changes_in_memory = 4096;
From 4096 changes Postgres spills changes to disk:
 12048 /*
 22049  * Check whether the transaction tx should spill its data to disk.
 32050  */
 42051 static void
 52052 ReorderBufferCheckSerializeTXN(ReorderBuffer *rb, ReorderBufferTXN *txn)
 62053 {
 72054     /*
 82055      * TODO: improve accounting so we cheaply can take subtransactions into
 92056      * account here.
102057      */
112058     if (txn->nentries_mem >= max_changes_in_memory)
12[...]
132065 /*
142066  * Spill data of a large transaction (and its subtransactions) to disk.
152067  */
162068 static void
172069 ReorderBufferSerializeTXN(ReorderBuffer *rb, ReorderBufferTXN *txn)
182070 {
192071     dlist_iter  subtxn_i;
202072     dlist_mutable_iter change_i;
212073     int         fd = -1;
222074     XLogSegNo   curOpenSegNo = 0;
232075     Size        spilled = 0;
242076     char        path[MAXPGPATH];
252077
262078     elog(DEBUG2, "spill %u changes in XID %u to disk",
272079          (uint32) txn->nentries_mem, txn->xid);
Setting log_min_messages parameter to debug2, we can highlight this behavior.
The goal is to display the message corresponding to the line 2078.
Without any particular activity, here is the content of the pg_replslot directory:
 1ls pg_replslot/* -alh
 2pg_replslot/mysub:
 3total 4,0K
 4drwx------ 2 postgres postgres  19 févr. 18 15:46 .
 5drwx------ 4 postgres postgres  33 févr. 18 11:51 ..
 6-rw------- 1 postgres postgres 176 févr. 18 15:46 state
 7
 8pg_replslot/mysub3:
 9total 4,0K
10drwx------ 2 postgres postgres  19 févr. 18 15:46 .
11drwx------ 4 postgres postgres  33 févr. 18 11:51 ..
12-rw------- 1 postgres postgres 176 févr. 18 15:46 state
I have two directories, corresponding to two replication slots. Indeed, I created a publication and two instances subscribed to the same publication. They each have their replication slot: mysub and mysub3.
Example with a single transaction
Let’s add rows to a table belonging to a publication.
 1begin;
 2BEGIN
 3postgres=# select count(*) from t1;
 4 count
 5-------
 6     0
 7(1 ligne)
 8
 9postgres=#  insert into t1 (select  i, md5(i::text) from generate_series(1,1000) i);
10INSERT 0 1000
11postgres=#  insert into t1 (select  i, md5(i::text) from generate_series(1,1000) i);
12INSERT 0 1000
13postgres=#  insert into t1 (select  i, md5(i::text) from generate_series(1,1000) i);
14INSERT 0 1000
15postgres=#  insert into t1 (select  i, md5(i::text) from generate_series(1,1000) i);
16INSERT 0 1000
17postgres=#  insert into t1 (select  i, md5(i::text) from generate_series(1,95) i);
18INSERT 0 95
19select count(*) from t1;
20 count
21-------
22  4095
23(1 ligne)
So far we have not reached the threshold of 4096. The directory does not contain the state file yet:
 1ls pg_replslot/* -alh
 2pg_replslot/mysub:
 3total 4,0K
 4drwx------ 2 postgres postgres  19 févr. 18 15:52 .
 5drwx------ 4 postgres postgres  33 févr. 18 11:51 ..
 6-rw------- 1 postgres postgres 176 févr. 18 15:52 state
 7
 8pg_replslot/mysub3:
 9total 4,0K
10drwx------ 2 postgres postgres  19 févr. 18 15:52 .
11drwx------ 4 postgres postgres  33 févr. 18 11:51 ..
12-rw------- 1 postgres postgres 176 févr. 18 15:52 state
Let’s add a line:
1insert into t1 (select  i, md5(i::text) from generate_series(1,1) i);
2INSERT 0 1
3postgres=# select count(*) from t1;
4 count
5-------
6  4096
7(1 ligne)
This time, threshold is reached (if (txn-> nentries_mem> = max_changes_in_memory).
Wal sender process will spills changes to apply on disk.
We find in the logs these messages (with log_min_messages = debug2):
1[1977] postgres@postgres DEBUG:  spill 4096 changes in XID 51689068 to disk
2[2061] postgres@postgres DEBUG:  spill 4096 changes in XID 51689068 to disk
Corresponding to both wal sender processes:
1ps faux |grep -E '(1977|2061)'
2postgres  1977  3.3  0.3 390496 37984 ?        Ss   11:38   8:54  \_ postgres: 10/main: wal sender process postgres 192.168.1.26(44188) idle
3postgres  2061  3.4  0.3 390496 37932 ?        Ss   11:38   9:10  \_ postgres: 10/main: wal sender process postgres 192.168.1.26(44192) idle
At the same time, if we look at the contents of the directory pg_replslot, we note that new files have appeared:
 1ls pg_replslot/* -alh
 2pg_replslot/mysub:
 3total 660K
 4drwx------ 2 postgres postgres   60 févr. 18 15:53 .
 5drwx------ 4 postgres postgres   33 févr. 18 11:51 ..
 6-rw------- 1 postgres postgres  176 févr. 18 15:53 state
 7-rw------- 1 postgres postgres 656K févr. 18 15:53 xid-51689068-lsn-92-98000000.snap
 8
 9pg_replslot/mysub3:
10total 660K
11drwx------ 2 postgres postgres   60 févr. 18 15:53 .
12drwx------ 4 postgres postgres   33 févr. 18 11:51 ..
13-rw------- 1 postgres postgres  176 févr. 18 15:53 state
14-rw------- 1 postgres postgres 656K févr. 18 15:53 xid-51689068-lsn-92-98000000.snap
Each wal sender had to serialize changes on disk.
Please note that one change here means one tuple, not one SQL statement. For example, a single insert of 4096 lines will result in the writing of a *.snap file.
Edit: Postgres hackers changes the snap extension to spill for Postgres 12:
 1commit ba9d35b8eb8466cf445c732a2e15ca5790cbc6c6
 2Author:     Jeff Davis <jdavis@postgresql.org>
 3AuthorDate: Sat Aug 25 22:45:59 2018 -0700
 4Commit:     Jeff Davis <jdavis@postgresql.org>
 5CommitDate: Sat Aug 25 22:52:46 2018 -0700
 6
 7    Reconsider new file extension in commit 91f26d5f.
 8
 9    Andres and Tom objected to the choice of the ".tmp"
10    extension. Changing to Andres's suggestion of ".spill".
11
12    Discussion: https://postgr.es/m/88092095-3348-49D8-8746-EB574B1D30EA%40anarazel.de
Example with two transactions
Second example, with two transactions modifying the table t1.
The xid of the first transaction:
1select txid_current();
2 txid_current
3--------------
4     51689070
5(1 ligne)
That of the second transaction:
1select txid_current();
2 txid_current
3--------------
4     51689071
5(1 ligne)
If we insert 4096 rows in the first transaction:
 1ls pg_replslot/* -alh
 2pg_replslot/mysub:
 3total 660K
 4drwx------ 2 postgres postgres   60 févr. 18 16:08 .
 5drwx------ 4 postgres postgres   33 févr. 18 11:51 ..
 6-rw------- 1 postgres postgres  176 févr. 18 16:08 state
 7-rw------- 1 postgres postgres 656K févr. 18 16:07 xid-51689070-lsn-92-98000000.snap
 8
 9pg_replslot/mysub3:
10total 660K
11drwx------ 2 postgres postgres   60 févr. 18 16:08 .
12drwx------ 4 postgres postgres   33 févr. 18 11:51 ..
13-rw------- 1 postgres postgres  176 févr. 18 16:08 state
14-rw------- 1 postgres postgres 656K févr. 18 16:07 xid-51689070-lsn-92-98000000.snap
Then, if we insert 4096 rows in the second transaction, we get new *.snap files:
 1ls pg_replslot/* -alh
 2pg_replslot/mysub:
 3total 1,3M
 4drwx------ 2 postgres postgres  101 févr. 18 16:08 .
 5drwx------ 4 postgres postgres   33 févr. 18 11:51 ..
 6-rw------- 1 postgres postgres  176 févr. 18 16:08 state
 7-rw------- 1 postgres postgres 656K févr. 18 16:07 xid-51689070-lsn-92-98000000.snap
 8-rw------- 1 postgres postgres 656K févr. 18 16:08 xid-51689071-lsn-92-98000000.snap
 9
10pg_replslot/mysub3:
11total 1,3M
12drwx------ 2 postgres postgres  101 févr. 18 16:08 .
13drwx------ 4 postgres postgres   33 févr. 18 11:51 ..
14-rw------- 1 postgres postgres  176 févr. 18 16:08 state
15-rw------- 1 postgres postgres 656K févr. 18 16:07 xid-51689070-lsn-92-98000000.snap
16-rw------- 1 postgres postgres 656K févr. 18 16:08 xid-51689071-lsn-92-98000000.snap
I tried to insert 3000 rows in each transaction, no snap file were written. Only when each transaction exceeds 4096 changes changes are spilled on disk.
Let’s commit the first transaction:
 1ls pg_replslot/* -alh
 2pg_replslot/mysub:
 3total 660K
 4drwx------ 2 postgres postgres   60 févr. 18 16:15 .
 5drwx------ 4 postgres postgres   33 févr. 18 11:51 ..
 6-rw------- 1 postgres postgres  176 févr. 18 16:15 state
 7-rw------- 1 postgres postgres 656K févr. 18 16:08 xid-51689071-lsn-92-98000000.snap
 8
 9pg_replslot/mysub3:
10total 660K
11drwx------ 2 postgres postgres   60 févr. 18 16:15 .
12drwx------ 4 postgres postgres   33 févr. 18 11:51 ..
13-rw------- 1 postgres postgres  176 févr. 18 16:15 state
14-rw------- 1 postgres postgres 656K févr. 18 16:08 xid-51689071-lsn-92-98000000.snap
Corresponding snap file is deleted by each wal sender. If we commit the second transaction, the second file is also deleted.
Note that these files appear for any modification (DELETE, UPDATE …).
What’s happen for a big transaction?
In this example we will insert a large amount of records into a transaction that will be committed later. This is to highlight how logical replication works.
Here are the queries that have been executed:
1BEGIN.
2INSERT INTO t1 (select  i, md5(i::text) FROM generate_series(1,10000000) i); --16:27:13
3-- wait few minutes
4COMMIT; --16:33:46
For information, inserts were done after 16:27:13 and ended at 16:28:16.
The commit was only done much later, at 16:33:46.
We find that both wal sender processes spill changes on disks:
1[1977] postgres@postgres DEBUG:  spill 4096 changes in XID 51689075 to disk
2[2061] postgres@postgres DEBUG:  spill 4096 changes in XID 51689075 to disk
3[1977] postgres@postgres DEBUG:  spill 4096 changes in XID 51689075 to disk
4[2061] postgres@postgres DEBUG:  spill 4096 changes in XID 51689075 to disk
5[1977] postgres@postgres DEBUG:  spill 4096 changes in XID 51689075 to disk
6[2061] postgres@postgres DEBUG:  spill 4096 changes in XID 51689075 to disk
Which produce a large amount of files:
 1[...]
 2pg_replslot/mysub3:
 3total 1,6G
 4drwx------ 2 postgres postgres 8,0K févr. 18 16:28 .
 5drwx------ 4 postgres postgres   33 févr. 18 11:51 ..
 6-rw------- 1 postgres postgres  176 févr. 18 16:28 state
 7-rw------- 1 postgres postgres 1,1M févr. 18 16:27 xid-51689075-lsn-92-98000000.snap
 8-rw------- 1 postgres postgres  15M févr. 18 16:27 xid-51689075-lsn-92-99000000.snap
 9-rw------- 1 postgres postgres  16M févr. 18 16:27 xid-51689075-lsn-92-9A000000.snap
10-rw------- 1 postgres postgres  16M févr. 18 16:27 xid-51689075-lsn-92-9B000000.snap
11-rw------- 1 postgres postgres  16M févr. 18 16:27 xid-51689075-lsn-92-9C000000.snap
12[...]
Here are some charts from Netdata:
CPU
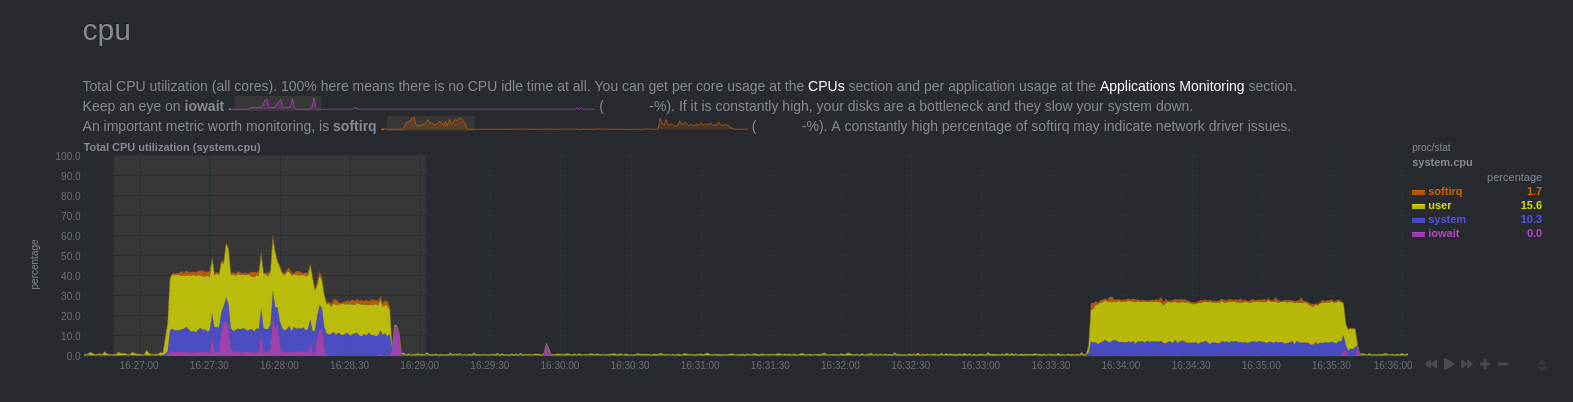
CPU
There is a high CPU load, up to 16:28:16 where it drops a little. Then at 16:28:48 load drops to 0. There is a rise in the load at 16:33:46.
How to explain these results?
At the first peak of load, there were several processes that consumed the resource:
- the backend that inserted the data
- both wal sender processes
The machine has 8 logical cores, each process uses only one core. About 13% per process.
At 16:28:16, the backend had just completed the insertion. However wal sender processes continued to be active. WAL Decoding and transactions serialization are quite expensive.
Finally, at 16:33:46, the transaction is committed. It did not affect the backend load. On the other hand, wal sender processes began to read snap files produced on disk to transmit changes to subscribers.
Note that the changes were visible on the subscriber side only around 16:35:40. Once the changes have been replayed. Replay is longer than the insertion. It depends a lot of the performances of the processors (CPU bound).
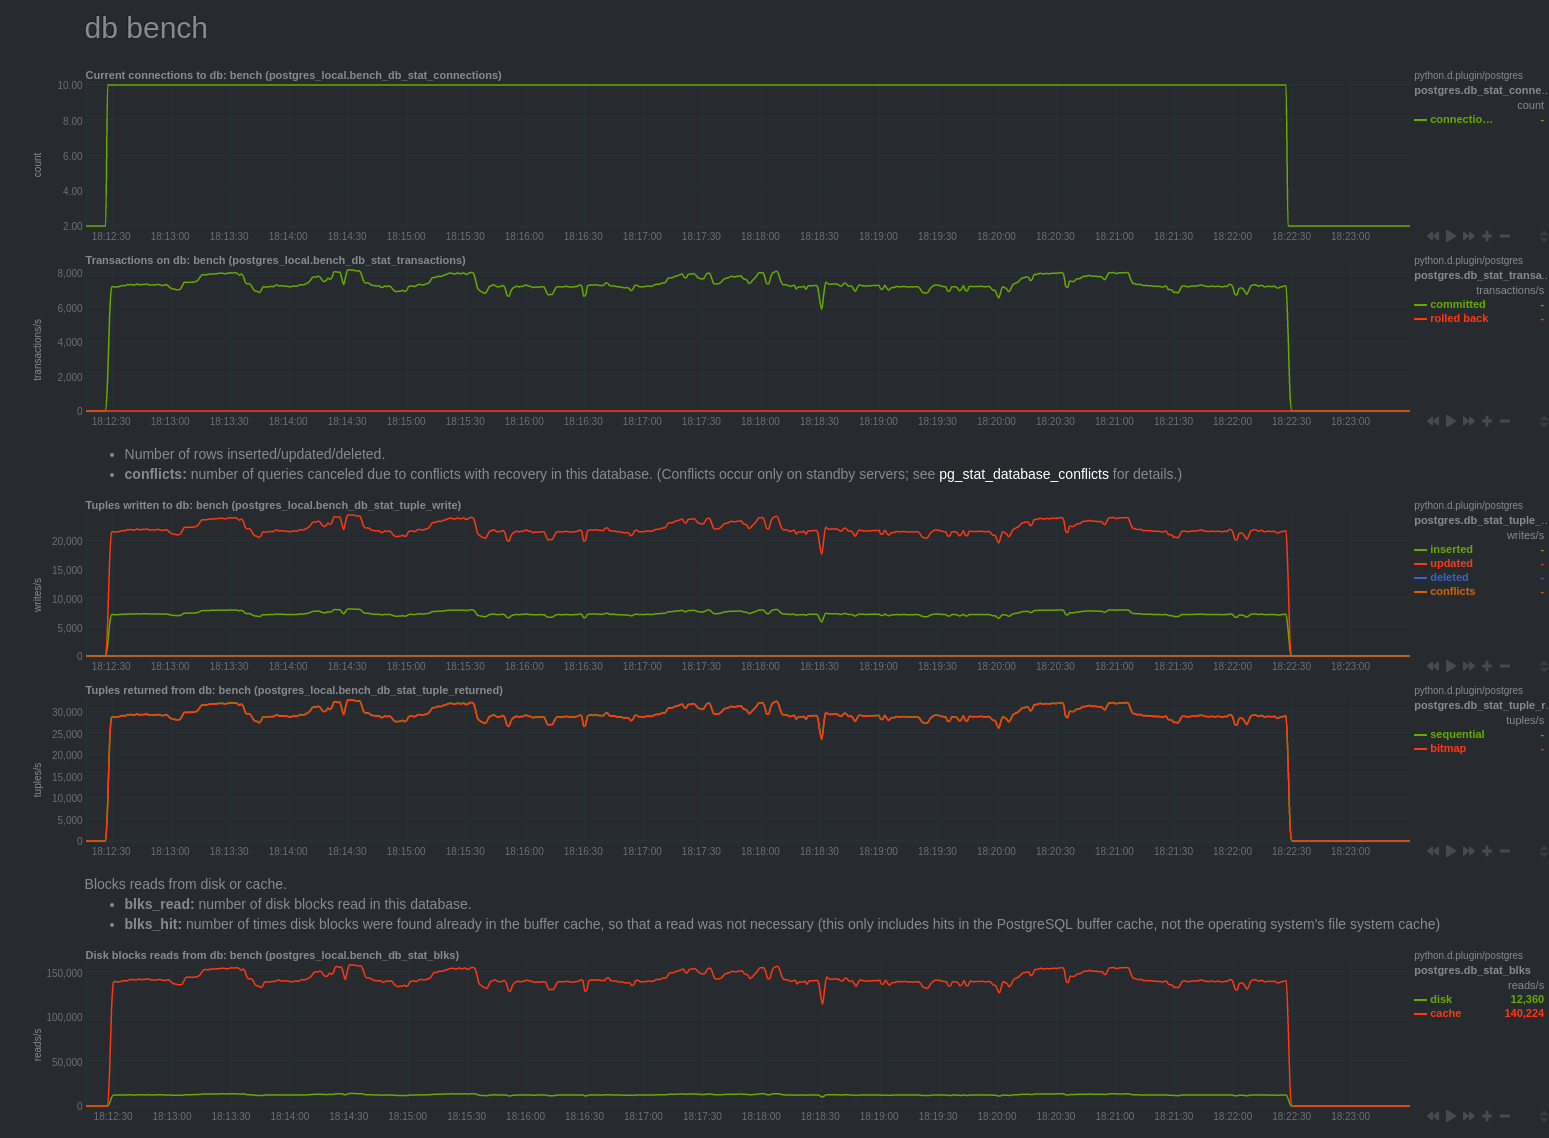
Database-wide statistics
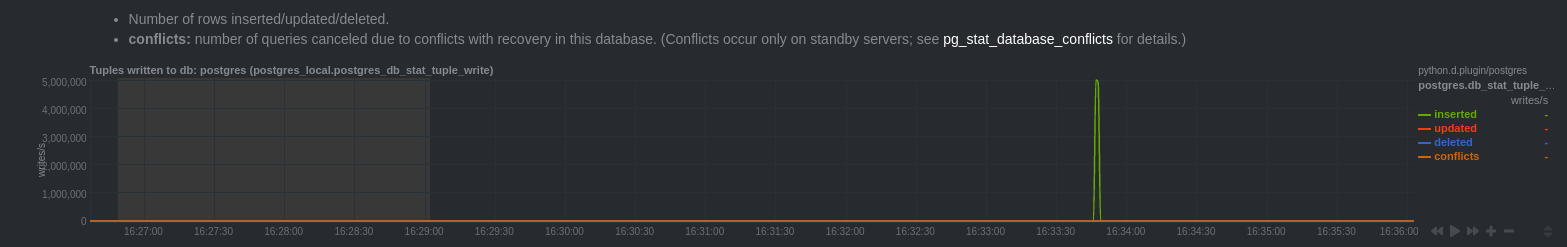
tuple inserted
There is a peak insertion at 16:33:46. This corresponds to the moment when the transaction has been committed.
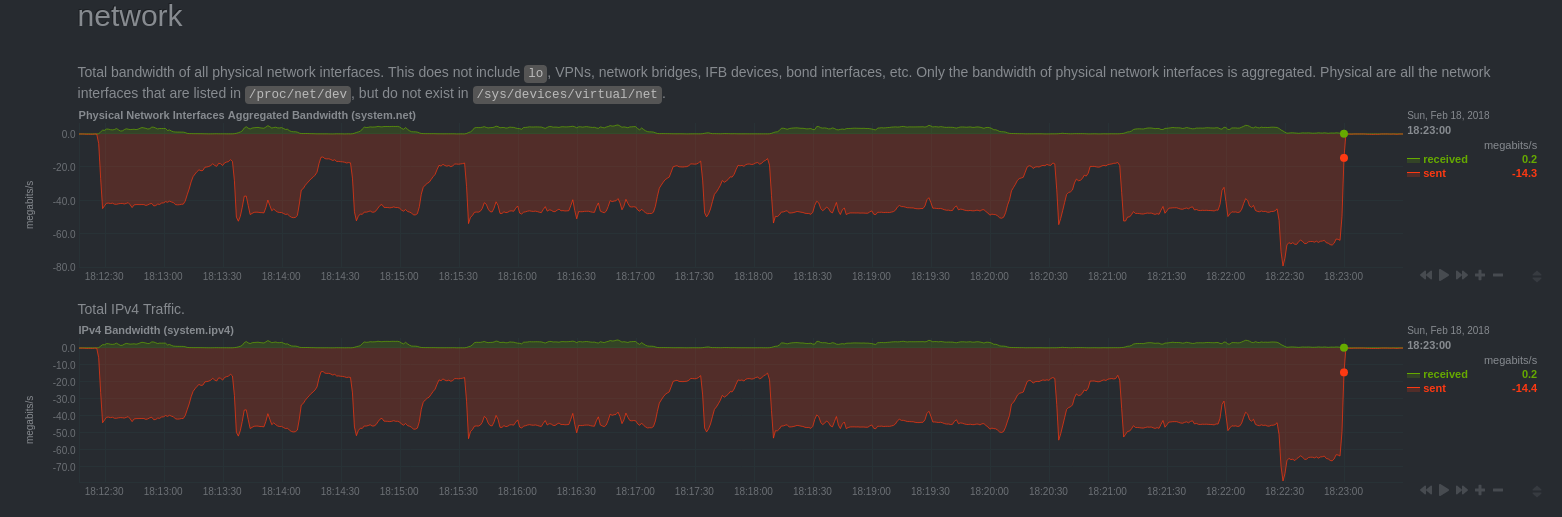
Network

Network
There is a significant network traffic between 16:33:46 and 16:35:40. We can deduce that the changes are only transmitted after the commit.
Changes are not transmitted by using streaming method. This has the advantage to avoid sending changes that would not be committed. On the other hand, this adds time to changes application.
Thomas Vondra has submitted a patch to improve this use case: logical streaming for large in-progress transactions
For the moment the patch has not been accepted yet. It requires adding information in the WAL. The community is very cautious in which concerns everything that can have an impact on performance.
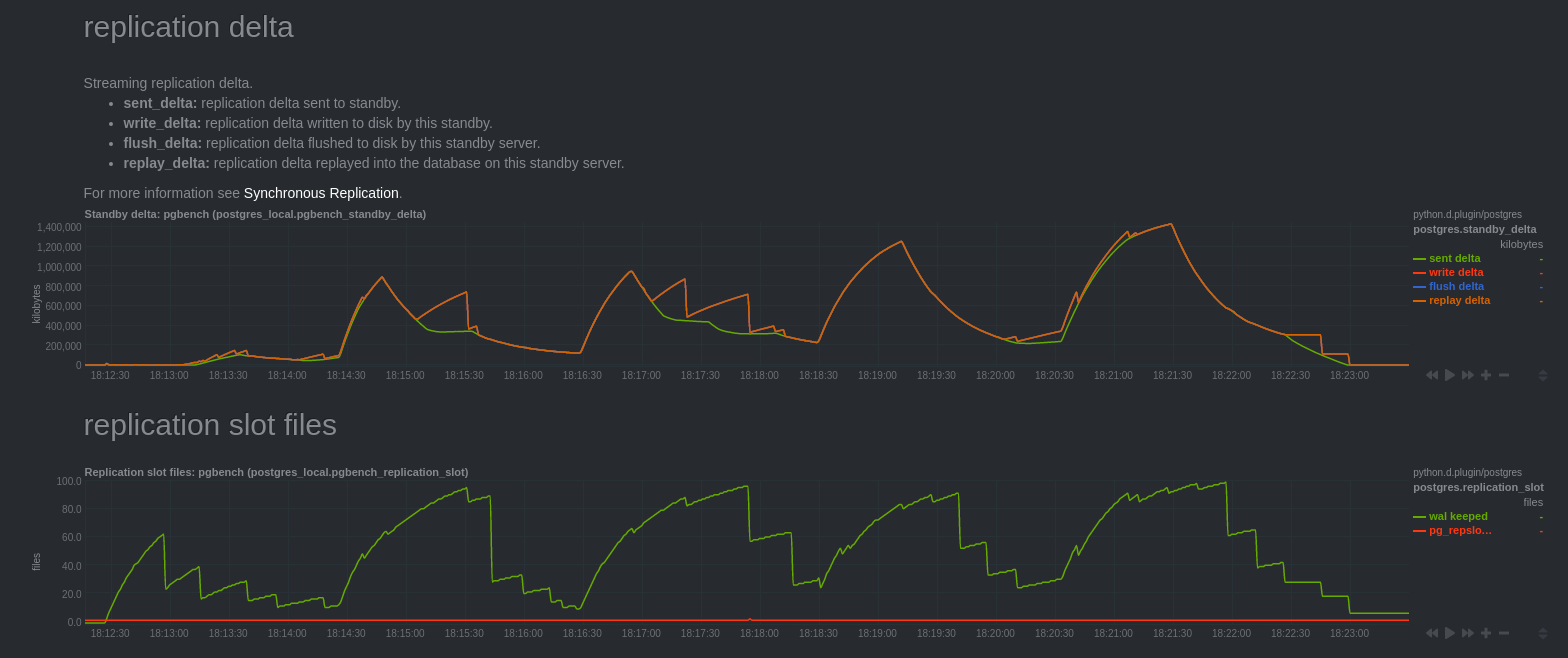
Replication
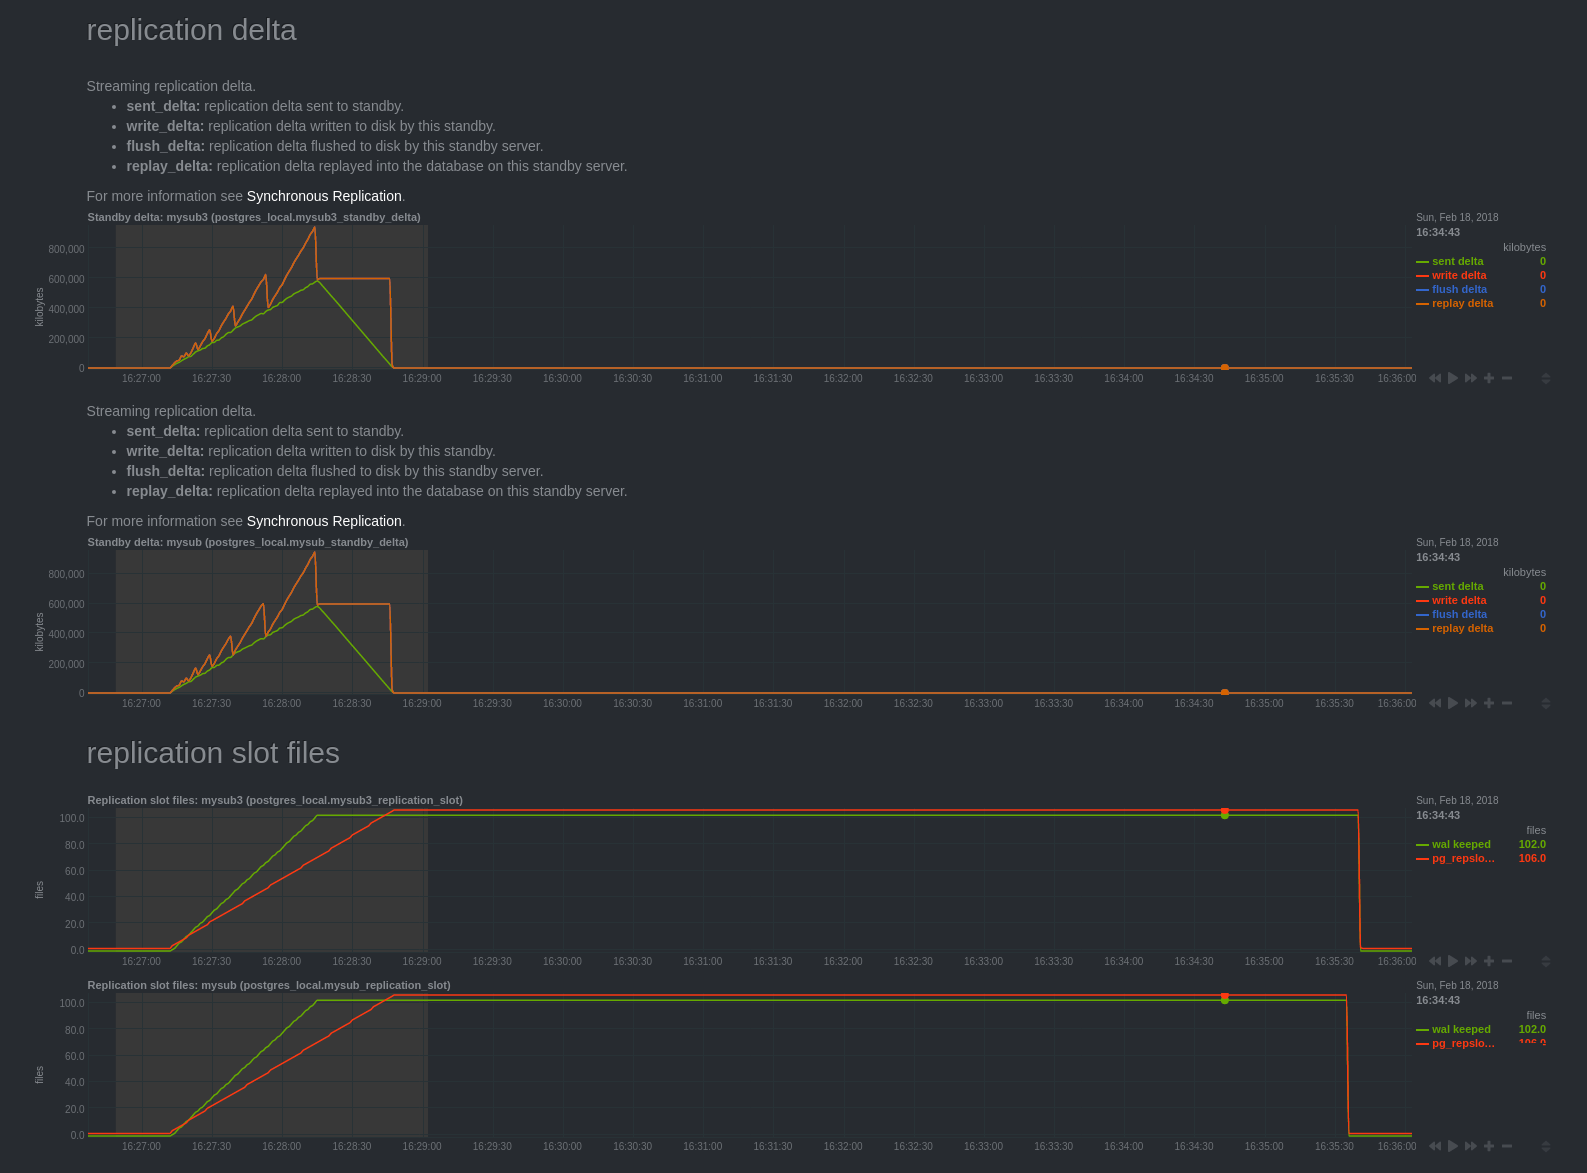
Replication delta
We can notice that “Streaming replication delta” charts, measuring the delta of
replication from the pg_stat_replication view are hard to explain.
Normally they show secondary server replication delay. Except
we have just seen that the application of the changes is only made at commit time,
at 16:33:46. But charts seem indicate that the secondaries servers were
delayed until 16:28:48.
The curves “write delta”, “flush delta” and “replay delta” are similar. The curve “sent delta” is quite different.
My understanding of these graphs is that “write delta”, “flush delta” and “replay delta” correspond to the logical decoding delay compared to sent data.
At 16:28:16, the query finished, “sent delta” stops growing and decreases as logical decoding advance.
We can confirm this thanks to “replication slot files” chart, the curve “pg_replslot files” is the number of files in the directory “pg_replslot” of each replication slot. This one is growing and stops to grow at the same time as the curves “write delta”, “flush delta” and “replay delta” go back to 0.
We can notice postgres have to keep WALs until the transaction has been committed. It is quite logical, if a crash occurs, you should be able to read WALs to proceed to logical decoding again.
Finally, at 16:35:40 changes have been transmitted to the subscriber side, postgres can finally clean WALs and snaps files.
OLTP workload
And with OLTP workload? For this test, I used pgbench launched for 10 minutes on a base from which all tables are replicated.
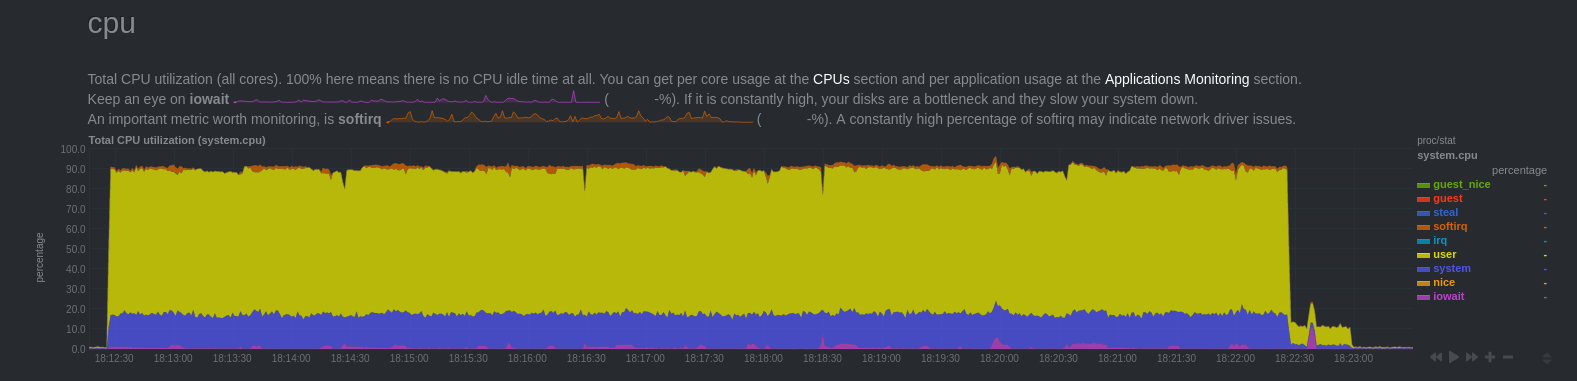
CPU
Network activity
Xact
Replication delta
Note that network traffic drops at the same time as we observe replication delay growth. This corresponds to periods when secondary were CPU bound (unfortunately I do not have Netdata chart on the secondary).
This can be explained by the fact that the replay is done only by a single bgworker process who had trouble supporting the load (less powerful machine). Moreover we can see that the secondary catch up the delay a few seconds after the end of the bench.
Another important point is that there is no snap file written on disk. This confirms the comment in the code, indicating that in case of OLTP workload, changes are kept in memory and not spilled on disk.
Conclusion
We can see that the logical replication applies quite well in the case OLTP workload as long as the secondary is able to follow application of the changes. This implies that write traffic is not too important at the risk of having a secondary that has difficulty in follow the charge: changes replay are made by a single process.
On the other hand, in cases where workload is different (OLAP), where requests lead to important changes, postgres will have to spill changes on disk. Logical decoding and network transfer result in a delay which can be significant.

For seven years, I held various positions as a systems and network engineer. And it was in 2013 that I first started working with PostgreSQL. I held positions as a consultant, trainer, and also production DBA (Doctolib, Peopledoc).
This blog is a place where I share my findings, knowledge and talks.