Postgres and Netdata : apply to autovacuum and pg_stat_bgwriter
Table of Contents
Some time ago, I discovered Netdata. This tool allows to collect many metrics (CPU, network, etc).
The strength of Netdata is to be quite light and easy to use. It collects data every second, everything is stored in memory. There is actually no history. The goal is to have access to a set of metrics in real time. 1
I added several charts for PostgreSQL, taking a lot of ideas from check_pgactivity.
Here is the presentation and explanations of some charts. Some highlight the behavior of PostgreSQL.
NB: The charts presented here may not correspond to the final version. Several charts have been splited in order to distinguish different operations (reads, writes), and processes (backend, checkpointer, bgwriter). 2
I would like to thank Guillaume Lelarge who reviewed this post :)
Autovacuum
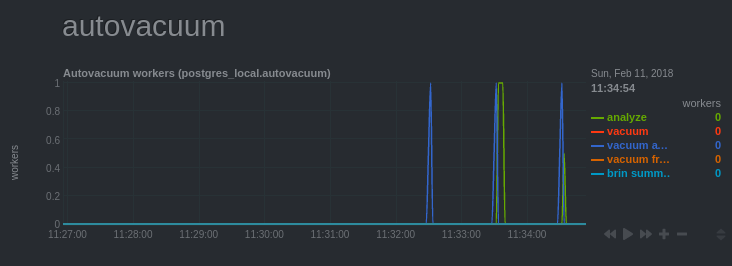
This chart shows the activity of the processes called “autovacuum workers”, launched by the “autovacuum launcher”. Their role is to perform maintenance tasks in order to:
- Clean dead rows
- Update statistics (see Statistics, cardinality, selectivity)
- Freeze old rows to avoid wraparound (See Transaction Id Wraparound in Postgres)
Usually, there is no need to worry, the default configuration is enough in most situations. However, it may happen that it is required to fine tune the configuration of the autovacuum.
For example, if the activity is very sustained and the number of processes launched
reaches regularly autovacuum_max_workers. In such a case, it may be advisable:
- to increase the number of autovacuum workers (if there are many tables to process at one time)
- to make the processes more aggressive (when tables are large).
Indeed, their activity is constrained by the parameters
autovacuum_vacuum_cost_delayandautovacuum_vacuum_cost_limitso that this task is done in background to minimize the impact on other processes that process queries.
Bgwriter
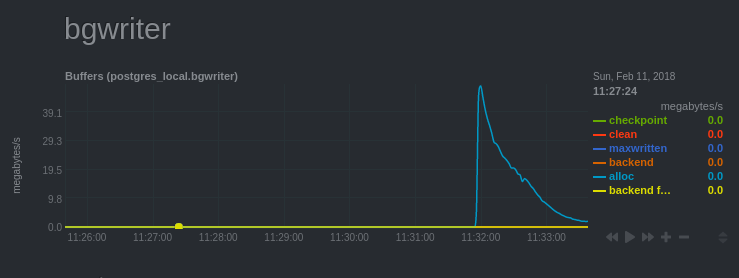
This chart is called Bgwriter because of the pg_stat_bgwriter view that gives these statistics.
The role of the “bgwriter” is to synchronize “dirty” blocks. These are blocks that have been modified in shared buffers but not yet written to data files (don’t worry, they already are written on disk within a WAL).
The “checkpointer” is also in charge of synchronizing these blocks. Writes
are smoothed in background (this depends on the checkpoint_completion_target parameter).
The bgwriter occurs when backends need to release blocks in
shared buffers, unlike the checkpointer which does it at a checkpoint.
Going back to the chart, the blue curve corresponds to the number of blocks that had to be allocated in shared buffers. The chart has this shape because the screenshot was taken during a pgbench load test while the server had just been started.
We can see quite clearly the effect of the cache which is gradually loading. It is quite visible because the collection is done every second.
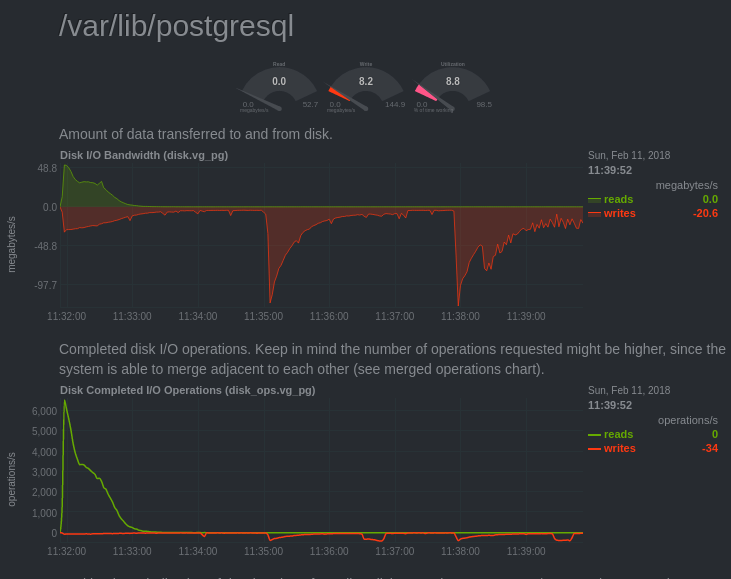
We can see this effect of loading the cache on several charts:
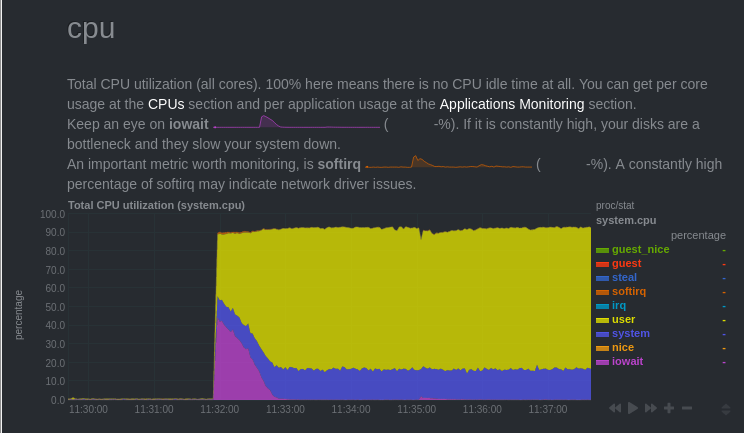
On the graph, the interesting area is the pink one. You see that, at the beginning of the test, CPUs were waiting for disk access.
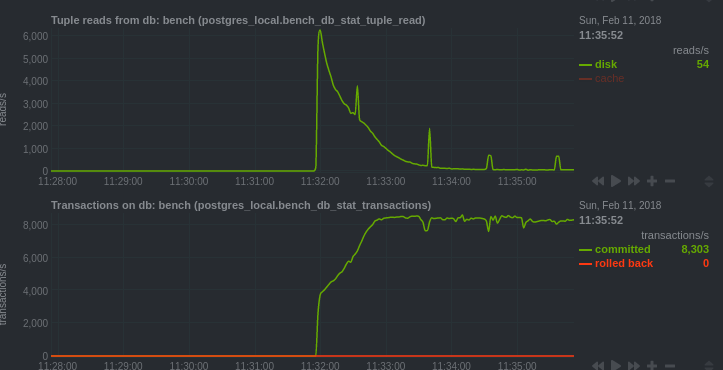
Here we can see that postgres had to read the blocks from the disk. The curve decreases because subsequent reads are from shared buffers.
We can also see that the number of transactions per second increases, then stabilizes once the data is loaded into shared buffers.
We observe the same phenomenon on this chart:

We can see that it took 1min30sec to load the cache.
-
See : Netdata Performance ↩︎
-
The Pull Request has been merged : Add charts for postgres ↩︎